Incentives, accountability and indicators - assessing sanitation progress through a Total Service Gap

The success of the Sustainable Development Goals depends upon whether they create the right incentives for actors at the national level. However, these incentives are unlikely to emerge without global accountability. Our recent paper – published in a special issue of Water journal – examines how the global SDG indicators influence incentives and accountability in the sanitation sector. Ahead of AfricaSan and FSM5, WaterAid's Stuart Kempster and Andrés Hueso propose a new measure – the Total Service Gap – as an attempt to overcome the risks identified.
How do global indicators influence incentives?
Progress towards the SDG 6 sanitation target is measured by "the proportion of the population using safely managed sanitation services." This indicator is monitored by the WHO/UNICEF Joint Monitoring Programme's 'sanitation service ladder', pictured below.
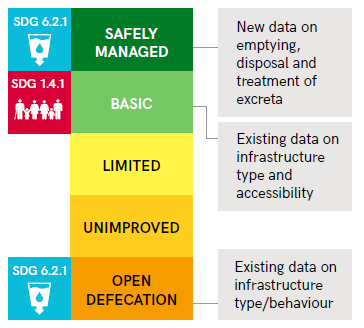
This monitoring framework defines the standards against which sanitation is judged, creating various positive incentives. For example, the ambition of 'safely managed' sanitation has stimulated action around the management of faecal waste. And the target, by specifying the elimination of open defecation, helps to maintain a focus on both ends of the service ladder.
However, these indicators also create perverse incentives. Governments and development partners may be tempted to prioritise upgrading existing services to 'safely managed' as this is likely to be the most cost-effective way of making progress against the global target. Yet this creates a risk that those who have the lowest levels of service will be left further behind. Similarly, there are accounts of reduced appetite for investing in shared sanitation since the adoption of the SDGs, despite the fact that high quality shared facilities may be the best option to improve service levels where household sanitation is not feasible.
How do global sanitation indicators influence accountability?
The SDGs rely on mutual accountability to drive progress around its shared agenda. For mutual accountability to get traction, it is vital that indicators used to track progress can facilitate comparisons of progress over time.
In this respect, the sanitation service ladders can be problematic. While they provide comparable data across countries, it can be difficult to compare progress over time in a way that accounts for changes at each rung of the ladder. For instance, which has made the greater progress: a country with a five percent increase in safely managed services, or a country with a 10 percent increase in basic services?
What is the Total Service Gap?
The Total Service Gap is a sanitation metric which seeks to address these risks by assigning a weight to each service level and combining data on each rung of the service ladder. This measure shows how far a country is from universal safely managed services - a total service gap of 100% represents universal open defecation, and a gap of 0% represents universal safely managed services.
This makes sure improvements at each level of service count towards the overall assessment of progress. It also helps to facilitate comparisons over time, accounting for progress at different rungs of the ladder in a more consistent manner.
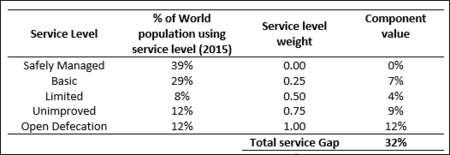
Our recent paper examines methodological options for determining the weights for each service level, and concludes that a uniform model is most suitable. The table below shows how this works, using the JMP global estimate for sanitation services in 2015.
How could the Total Service Gap be used?
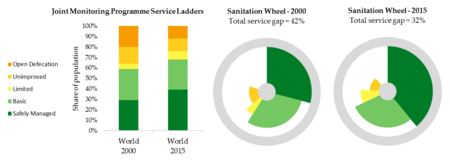
Fig. 2 below compares the JMP service ladders with a ‘sanitation wheel’. The service ladder provides a good snapshot of sanitation services that are used at a specific point in time. However, it can be difficult to visualise progress over time. In the sanitation wheel, the Total Service Gap is represented by white space – as progress is made at each rung, the white space decreases. This can be used for comparisons across time, and across countries, and can help to better visualise progress towards the target of universal safely managed services.
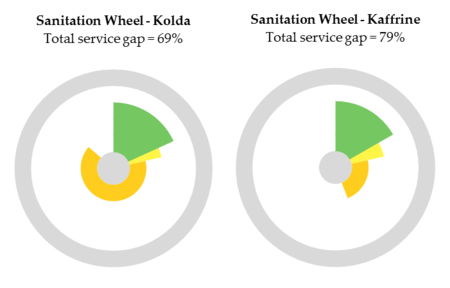
While the application of the Total Service Gap at a sub-national level is limited by a lack of data on safely managed services, this example from Senegal demonstrates how it could be useful for policy makers:

Fig. 3 plots the Total Service Gap for sub-national regions of Senegal against their level of ‘at least basic services’. It shows that Kaffrine, Tambacounda, Kedouhou, and Kolda each have a very similar level of basic services - 17%, 17%, 17%, and 18% respectively. Yet their Total Service Gap differs by over 10 percentage points – Kolda with 69% is in a much better position than Kaffrine with 79%. Understanding and visualising this difference, as shown below, could support planning and budgeting processes, helping to improve the targeting of resources.
What about an Inequality-adjusted Service Gap?
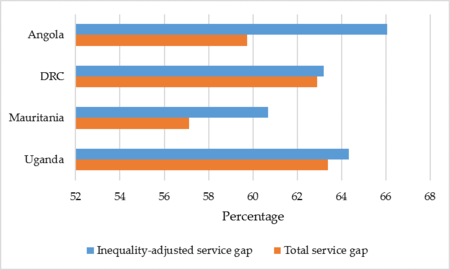
When data on all service levels have been collapsed into one figure, it is possible to combine this with the JMP’s wealth quintile data to calculate an 'Inequality-adjusted Service Gap' (following a similar methodology to the Inequality-adjusted Human Development Index). This is a measure of progress that penalises inequality; where there is no difference in sanitation access across wealth quintiles, the Inequality-adjusted Service Gap exactly equals the Total Service Gap. As the level of inequality increases, the Inequality-adjusted Service Gap becomes larger than the Total Service Gap.
For example, the graph below demonstrates that while the Total Service Gap in Angola is lower than in Uganda and the Democratic Republic of Congo, Angola performs worse when adjusted for inequality. This type of analysis can help draw attention to the equity of sanitation development and the SDG’s 'leave no one behind' agenda.
Do we really need more sanitation metrics?
Given that many countries are still in the process of adapting to the requirements of SDG monitoring, the introduction of even more sanitation metrics is a valid concern. However, the Total Service Gap doesn’t require collection of more, or different, data. It is only a re-interpretation of existing global data. In this way, it can help to frame global discourse in ways which limit the risks associated with perverse incentives and weakened mutual accountability.
This approach does not lessen the need for more detailed, nuanced data to inform national decision-making. Nor does it undermine the urgency with which governments should seek to fill data gaps on safely managed services and define national indicators for high-quality shared sanitation. WaterAid are working with partners globally on both these issues.
Nevertheless, the Total Service Gap and its inequality-adjusted cousin are analytical devices which could add value to global discourse and help advocate for the progressive realisation of the right to sanitation.
Are you interested in how SDG indicators influence incentives and accountability in the sanitation sector? Then read the full paper >


