From spreadsheets to mWater: how a data platform has improved WASH service management in Pakistan
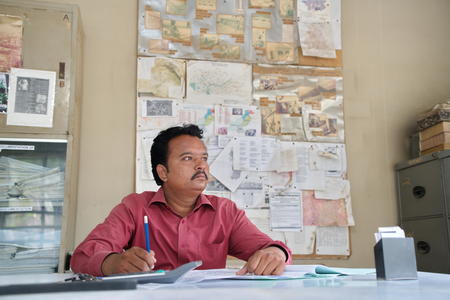
 mapping team working in the office on a map for urban sanitarian project in Karachi, Sindh province, Pakistan. April 2015.")
How can we use an online system to enhance reporting in interventions to improve access to water, sanitation and hygiene (WASH)? Sabir Hussain, Monitoring and Evaluation Coordinator at WaterAid Pakistan, describes the team’s shift from using Excel to mWater for partner reporting, and the benefits this has brought to our partners.
Data play a pivotal role in decisions that directly affect people. In recent times technology has made data collection, management and dissemination, and data-based decision making, easier, cheaper and more efficient. Development organisations have also used information and computer technology (ICT) platforms and online data collection to strengthen transparency and accountability.
At WaterAid Pakistan we used to monitor our WASH interventions and manage our data using Excel spreadsheets. This presented many challenges including:
- Double counting communities and users’ monthly data because of lack of quality-control systems and capacity at data entry level.
- Data integrity issues, for example incorrect of spellings of names for communities and institutions.
- Inability to build a multi-year database for projects, coupled with the issues of using large Excel files such as longer loading times and increased complexity.
- Most importantly, staff and partners found it difficult to use multiple spreadsheets, databases and the data generated. The process wasn’t user friendly, especially for people without advanced Excel skills, and they didn’t find it useful in day-to-day project management.
A robust data management system
To address these challenges, we needed a new and robust system. In 2014, following a review of ICT solutions data management, WaterAid began a partnership with mWater – an online platform that facilitates WASH-specific mobile data collection, analysis and sharing – and the results were good.
So we began to shift Excel-based data management to mWater for all our projects, with the following aims:
- To reduce duplication of efforts in collecting data required for internal and external use.
- To support programme teams by providing relevant data for activities and outputs, to better track projects’ performance and use the same data for internal and external reporting requirements. In analysis the data could easily be disaggregated by gender, location, donor, partners, projects and funding.
- To reduce the risk of human error and inconsistencies in data entry.
- To increase data security and the ability to archive information to track data over multiple years.
- To develop dashboards to present a variety of analyses for different audiences.
We made several decisions when converting the data management system from Excel to mWater that we believe contributed to its success.
1. Make the system more user friendly
We recognised that, to keep the mWater data collection survey as user friendly as possible, it was important to keep everything within one data collection survey, despite the data being used for lots of different purposes (activity tracking, user number reporting and keeping a record of infrastructure supported). mWater offers some great features, which we used to set up user journeys controlled by options the user selects, so they are only shown data fields to fill in that are relevant to why they are using the survey.
2. Make the data meaningful
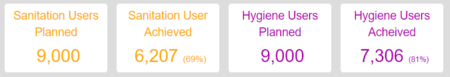
It is crucial that any data monitoring and analysis system shows the complete picture and the context of the numbers shown. We therefore recognised that it was important to have both achievements and targets on the analysis dashboards.
Using the detailed implementation plan for every project, we worked with project leads to quantify monthly targets. We entered these in mWater before the survey was rolled out, allowing ‘target’ data to be easily shown on a chart or table next to the ‘actuals’, giving dashboard viewers the complete picture about progress – see the example below.
3. Test, test, test!
We recognised the importance of thoroughly testing any new system before it is rolled out, to ensure it is as useful as possible and to avoid time and resource investments going to waste. We ran a full demonstration, completed surveys, entered targets and progress and developed demo dashboards, to learn more about the applicability and feasibility of the survey before rolling it out. We took feedback from our partners and programme team on the demo dashboards and made edits and adjustments to improve it.
Making sure the survey is useful for key audiences and users
Since our partners are the day-to-day users, we were keen to ensure they bought into and supported the new system. We visited partner teams individually in the field and listened to their challenges, hearing that a major limitation was that they didn’t have a single platform through which to monitor and track progress at community, sub-district and district levels.
The new survey would cater to their needs and continue to evolve alongside new requirements. In addition to the dashboard to view all WaterAid Pakistan’s data in a consolidated view, we also developed a separate dashboard for each partner that shows data at community, sub-district and district levels, and spent time with each partner individually to show them how to use the survey.
The result is that this new way of reporting is also helping partners’ field teams to better plan, monitor and implement their project activities, because they can see all their data in one place.
Learn, improve, repeat
We found that learning from experience and converting that into practice brings quality, adds value to work and creates an opportunity to expedite it. Our new survey helps to strengthen reporting and transparency, and allows different audiences to see interventions’ achievements in real time. mWater, combined with a new way of data management, monitoring and reporting, is benefiting WaterAid Pakistan, partner staff – and, ultimately, the communities we work with.
This blog is the second in a series describing WaterAid’s use of mWater as a tool for effective WASH service monitoring. Read How can online data platforms improve management of water, sanitation and hygiene services? here.


